Design space generation is encouraged in new product development.
Sep 1, 2014
By: Thomas A. Little, PhD
BioPharm International
Volume 27, Issue 9, pp. 46-49
A product’s or process’ design space is generally considered to be the area where process parameters safely (without failure or high amounts of degradation) can be processed and achieve all critical quality attributes (CQAs) and associated product acceptance criteria. Knowledge of product or process acceptance criterion (specification limits) is crucial in design space generation and use. International Conference on Harmonization (ICH) Q8(R2), 3.0 Glossary defines design space as follows (1):
“Design Space: The multidimensional combination and interaction of input variables (e.g., material attributes) and process parameters that have been demonstrated to provide assurance of quality. Working within the design space is not considered as a change. Movement out of the design space is considered to be a change and would normally initiate a regulatory post-approval change process. Design space is proposed by the applicant and is subject to regulatory assessment and approval.”
Design space is established through proper characterization techniques and is often an extrapolation of the response surface from a multifactorial designed experiment. The white area in Figure 1 indicates a safe operating area of the design space, and the shaded area indicates the edge of failure and the area of failure. Unfortunately, this graphical representation of the design space is misleading and requires supporting analysis to be sure the set point within the design space will have high success rates.
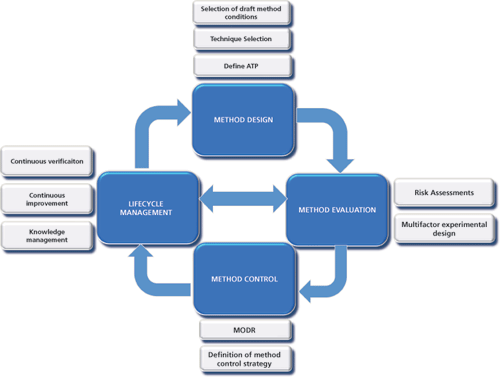 Figure 1: Design space and design margin.
The reason the design space alone is misleading is it represents the average surface response as opposed to individual batches, lots, vials, or syringes. The mean response may be safe, but the individual units or batch may not be and may experience high failure rates. Two additional analyses are required to assure the chemistry, manufacturing, and control (CMC) team and associated health authorities all set points are safe with low out-of-specification (OOS) rates (less than 100 parts per million [PPM]). An edge of failure and process capability analysis is needed.
Design Margin
Design margin is the measure of the distance from the set point or the mean response to the nearest edge of failure where acceptance criteria will fail and OOS conditions occur. The greater the design margin, the less likely OOS and lot acceptance failures may occur. Design margin alone is insufficient without an edge of failure and process capability analysis:
Design Margin (units) = Mean Response - Nearest Limit
Design Margin as % Mean = (Mean Response - Nearest Limit)/Mean
Design Margin as % of Tolerance = (Mean Response - Nearest Limit) / (USL-LSL)
Edge of Failure
USL is upper specification limit. LSL is lower specification limit.
Edge of failure is defined as the point in the design space where individual lots, batches, or vials will fail lot acceptance criteria. Edge of failure analysis is an important addition to the design space analysis. The edge of failure can be determined experimentally by exploring the design space until failures are found and by simulating the extrapolated design space even though failures were not experimentally detected. The first way is extraordinarily expensive and time consuming and not required by the health authorities. The second way is much more practical and a simple extension of the design optimization and set point selection. Edge of failure analysis helps to assess and define process risks (2).
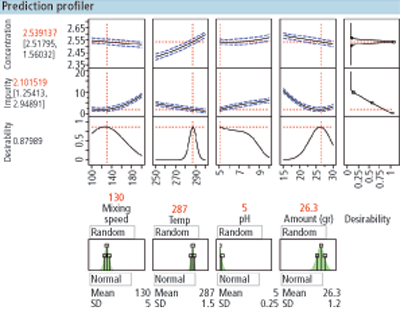 Figure 2. Simulation of the variation of X on Y.
To detect the edge of failure and to visualize the design space and associated design margin through simulation, the following process should be performed:
1. Conduct the designed experiment and build the model
2. Select the set points for each X factor in the model
3. Create a simulation of the variation in X and use the transfer function of X to Y
4. Determine the variation in each X factor and the distribution shape associated with each X factor (e.g., normal, lognormal) and add them to the simulation
5. Run 100,000-plus batch simulations at the selected set point (Figure 2)
6. Color code all batch failures (green=in-specification, red=out-of-specification)
7. Examine the design space at the set points of interest (Figure 3)
8. Generate the XY scatter graph with all limits to visualize the edge of failure (Figure 4)
9. Generate a histogram for each response and examine capability (Figure 5).
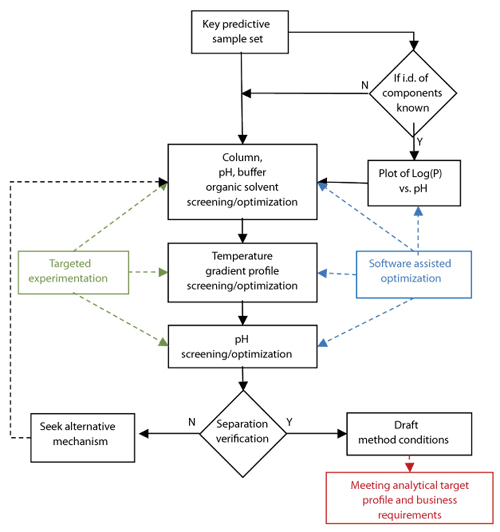 Figure 3. Misleading design space.
In Figure 4, the design space looks good relative to the set point. When the edge of failure analysis is generated, however, there is a high failure rate for concentration. Examination of the edge of failure makes sure the set point is safe in the design space and there is sufficient design margin to ensure the OOS rates are low (less than 100 PPM).
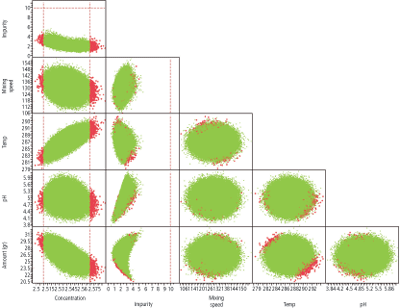 Figure 4: Edge of failure visualization. Red indicates failure.
Process Capability and Failure Rates
Process capability is a measure of the ability of the process to produce product that meets all CQAs and acceptance criteria (3). The ISO definition is “Process Capability: Ability of a process to produce a product that will fulfill the requirements of that product. The concept of process capability can also be defined in statistical terms.”
Figure 5: Process capability.
ICH Q6B Specifications: Test Procedures and Acceptance Criteria for Biotechnological/Biological Products, 2.3.1 Process-Related Considerations states (4):
“Adequate design of a process and knowledge of its capability are part of the strategy used to develop a manufacturing process which is controlled and reproducible, yielding a drug substance or drug product that meets specifications. In this respect, limits are justified based on critical information gained from the entire process spanning the period from early development through commercial scale production.”
 Table I: Measures of capability.
There are six primary statistical methods to define process capability. They are all convertible from one measure to another (see Table I):
Yield and/or Failure Rate--Data type: Pass/Fail (Categorical or Nominal)
Defect Rate--Defect Rate/Units (Categorical or Nominal)
Cpk—Min(Xbar-LSL,USL-Xbar)/(3*Stdev) (normal only)
K sigma—Cpk*3
Sigma Quality—Cpk*3+1.5
PPM—Failure rate lower limit + Failure rate upper limit * 1M. PPM is calculated by direct failure rate for the sample and area under the curve for the population.
Measures of process capability may be determined during development and confirmed during confirmation batch runs and formal process validation (5).
Cpk is a Poor Measure of Capability
Cpk has been around for many years as a measure of process capability. It is a poor measure and is not recommended as a metric for process capability. The primary reasons Cpk should not be used are as follows:
• It only measures the worst case.
• PPM failure rates for any Cpk value may be 1X or 2X the failure rate so the conversion into failure rate is unclear.
• It is only convertible into failure rates for normal distributions and is not convertible for nonnormal distributions as defined by ISO (6).
• There is no generalized accurate conversion from Cpk into a total failure rate for a drug product or drug substance as it is currently defined.
PPM as a Recommended Measure of Process Capability
Failure rate in PPM is the failure rate * 1,000,000. The only universal measure of capability is PPM. Yield, defect rates, and continuous measures (normal and nonnormal distributions) may be converted to PPM. PPM can further be converted into cost or other metrics of interest.
Conclusion
Modern drug development and ICH standards encourage design space generation in new product development. It is a best practice and increases product and process knowledge and reduces risk. Using a risk-based and multivariate approach is a best practice in generating the design space. Determination of failure rates and design margin during development is a best practice. One should include in submissions the design space, edge of failure, and process capability. The intended design space and how it is to be used within a controllable range should be clearly communicated to regulators. FDA generally welcomes discussion on design space with applicants; discuss the design space and submission logic with FDA working groups as needed.
References
1. ICH, Q8 (R2) Pharmaceutical Development (2009).
2. ICH, Q9 Quality Risk Management (2006).
3. ISO, ISO 9000:Quality Management (2005)
4. ICH, Q6B Specifications: Test Procedures and Acceptance Criteria for Biotechnological/Biological Products (1999).
5. FDA, Process Validation: General Principles and Practices (2011).
6. ISO 22514-1:2014, Statistical methods in process management—Capability and performance (2014).
About the author
Thomas A. Little is president of Thomas A. Little Consulting, [email protected].