![]()
 The biopharmaceutical industry has witnessed tremendous breakthroughs during the past few years. However, this advancement is accompanied by an increasing population with health problems and diseases. In addition, the growing list of super microorganisms that show broad-spectrum resistance to different classes of antimicrobials is becoming more common.
Up-to-date lists of product recalls due to contamination by objectionable microorganisms are provided by FDA (1). The Center for Food Safety and Applied Nutrition (CFSAN)—under FDA—provided a comprehensive collection of pathogenic microbes in Bad Bug Book including: Trychophyton species, Serratia marcescens, Neisseria meningitidis, Microsporum species, and Bacteroides fragilis, among others that should not be overlooked in microbiological quality control (2). Moreover, determination and identification of the nature and relative densities of microbial populations through trending analysis are essential for the appropriate selection of pre-filters rating and risk assessment studies that should be assessed for both upstream and downstream processes.
Good Practices in the Biopharmaceutical Industry
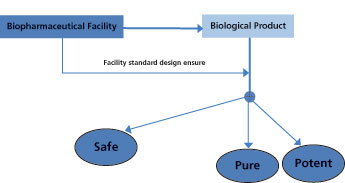
Because bio/pharmaceutical products are generally intended for ill populations, bioburden control throughout the whole manufacturing plant should be maintained effectively to minimize the risk of medicinal products contamination. According to the Public Health Service (PHS) Act and as illustrated in Figure 1, the biological product must be safe, pure, and potent.

The basic standards for establishing a facility for manufacturing, processing, and packaging biopharmaceutical products should, therefore, ensure that these three criteria are met consistently (3). Thus, the safety of the biological preparation is a major consideration, and the assurance that the finished product will be protected from microbial contamination is an integral part of product safety goals. Regulatory bodies stress the necessity of adhering to cGMP requirements for facilities manufacturing biologic products to ensure quality in both the process and product (4).
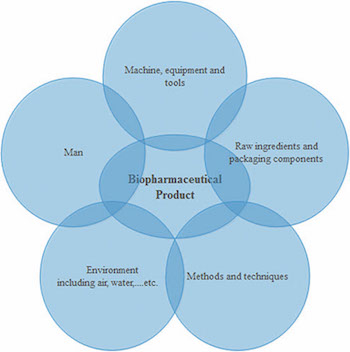
There are several factors that impact the level of microbial contamination in biopharmaceutical products either directly or indirectly, as shown in Figure 2. Human activity and normal tasks performed within a manufacturing facility may influence the other contributing factors significantly.

Bioburden contamination is affected by the degree of compliance to GXP rules. According to FDA’s definition, an “adulterated” pharmaceutical product is one which is manufactured under non-cGMP conditions. Even if the product itself meets specifications, it is still considered “adulterated” if it was not manufactured under cGMP standards in a cGMP environment (5). This is also evident from warning letters that have been issued by FDA (6).
Microbiological Testing Has its Limitations
Reliance on only quality control tests to judge the safe release of the final product to the market may be misleading because of the nature of the test sensitivity, which is normally low when low numbers of microbial load are present and which usually follows the Poisson or Binomial distribution pattern (7-9).
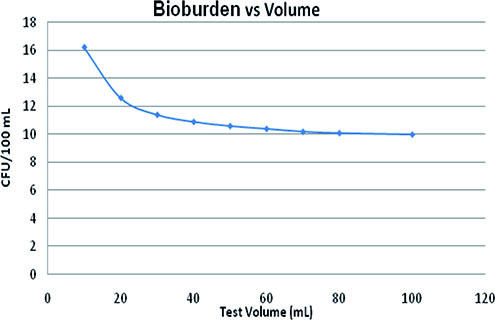
The relation between the test volume (mL) and the bioburden level required (colony forming unit [CFU]/100 mL) to maintain test sensitivity at the same level as that of bioburden density—10 CFU/100 mL for a 100-mL sample volume, i.e., probability of detection at 41.2%—can be described by Equation 1:
Y41.2%= 4.8 + 7.16 (X-1.22)/[0.05 + (X-1.22)]
[Eq. 1]
where X is the test volume (mL) and Y41.2% is CFU/100 mL that gives test sensitivity equivalent to that of 10 CFU/100 mL.
This equation was derived from Figure 3 according to Field (9). Thus, the influence of the reduction of the test volume on test sensitivity is considerably low. A 10-time reduction in the sample volume requires an increase in the number of CFU by approximately six to achieve the same sensitivity.
![]()

It should be noted, however, that as bioburden density gets lower, the sensitivity of the test decreases dramatically (9). An empirical equation that explains this concept is seen in Equation 2:
Ppass = 1.03/[(1 + e(0.32µ-3.7))1.23]
[Eq. 2]
where Ppass is the probability to pass the test undetected and µ is the number of CFU/100 mL.
Accordingly, the sensitivity of the test is about 1.0% when the actual bioburden is one CFU/100 mL and 50% with 11 CFU/100 mL, but approximates 96% at 20 CFU/100 mL. Thus, as the bioburden reduction increases (which is normally considered better from the manufacturing-control prospective), the possibility to detect the microbial count decreases.
In-Process Monitoring and Quality Controls
The in-process control (IPC) monitoring of bioburden during the processing of non-sterile bulk product is crucial, especially during the upstream and downstream controlling steps of a multi-step complex operation, such as -pre-filtering to prevent excessive microbial load from reaching and fouling the sterilizing filters (10). The application of statistical process control (SPC) will be important in such instances to spot areas of risk, defect, and/or improvement that require action(s) to be put in place.
Trending charts will allow visualization of the overall efficiency of the inspected process. A process with upper and/or lower control limit(s) (UCL/LCL) that are not confined to just within upper and/or lower specification (USL/LSL) limit(s) but are also stable over the short- and long-term, is stable and predictable in behavior (11). This approach proves that the operation is consistent and under statistical control. Accordingly, it should provide evidence of compliance to cGMP.
Broadly speaking, there are two types of control charts used in the pharmaceutical field: variable and attribute. Each chart has its specific use depending on the type of data and the process and/or characteristic under study and that is being monitored (12).
Attribute charts (such as the C chart, which represents the number of defects per item, or the U chart, for the number of defects per sample) are suitable for the trending of microbiological data. However, with the aid of some mathematical tools, microbiological results could be transformed so that the variable control charts might be applied (13). This gives an advantage to the variable control charts in microbiological quality control. Attempts have been made to apply these techniques to the microbiological monitoring of water, air, and surfaces in the pharmaceutical industry (14-16).
Establishing Microbiological Control Measures
The biopharmaceutical production line is subject to contamination from two main sources: firstly, operational endogenous organisms that are product/process specific; and secondly, microorganisms that are endemic to the facility. Several measures should be taken to ensure that bioburden is reduced within safe and controllable levels.
Validated sanitization and disinfection programs suitable for the type of activities and work load should be performed frequently and routinely. Appropriate clean-in-place (CIP) and sterilization-in-place (SIP) operations should be performed strictly for all lines within specified conditions. Sterilization filters with associated pre-filters should be adequately monitored and maintained at optimum conditions. Supply air ducts with associated high efficiency particulate air (HEPA) filters and heating, ventilation, and air conditioning (HVAC) systems should be regularly monitored and effectively maintained to supply the dedicated areas with expected clean air quality.
Operators and staff in the plant are an important factor because they may easily affect other influential parameters of microbial contamination in the -manufacturing plant, either directly or indirectly. Human beings have been identified as the source for approximately 75-80% of microbial contamination in clean rooms (17).
Great efforts are needed to deliver suitable knowledge, skills, awareness, and training to the working staff through rigorous policies, protocols, guidelines, references, and standard operating procedures (SOPs). Such efforts would positively impact the working environment and morale, with emphasis on a GXP-favorable attitude throughout the firm.
Conclusion
The biologics sector is continually expanding because these drugs demonstrate better therapeutic value in treating an increasing number of chronic diseases (18). Biologics manufacturing, however, costs more than small-molecule drug manufacturing in terms of research, investments, installations, maintenances, facilities, and technologies.
Microbial contamination and spoilage are among the most challenging problems that affect biologics manufacturers and patients. Thus, a continuous microbiological monitoring plan, coupled with SPC, should be used to assess the current state of bioburden reduction and control and to determine the improvements that are necessary. Effective defensive plans should be established for rapid actions upon detecting any signs predisposing the incursion of microbiological contamination, but it should always be taken into consideration that microbiological quality control testing cannot be used as a standalone measure independent of GXP.
References
1. L. Clontz, Microbial Limit and Bioburden Tests: Validation Approaches and Global Requirements, (CRC press Taylor & Francis, Boca Raton, FL, 2nd ed., 2009).
2. A.M. Cundell, “Comparison of Microbiological Testing Practices in Clinical, Food, Water and Pharmaceutical Microbiology in Relation to the Microbiological Attributes of Nutritional and Dietary Supplements”, Pharmacopeial Forum 28(3) (May-June 2002).
3. P.F. Hughes, “Aseptic Processing of Biological Products: Current Regulatory Issues,” presentation at the WCBP 2016 Symposium (Washington, DC, 2016).
4. CFR Title 21, 210.1-3, 211.4-31.
5. FDA, “Facts About the Current Good Manufacturing Practices (CGMPs),” accessed March 25, 2017.
6. FDA, “Warning Letters 2015,” www.fda.gov/Drugs, accessed March 24, 2017.
7. P. Cholayudth, “Application of Poisson distribution in establishing control limits for discrete quality attributes”, J. of Validation Technology 13(3)196-205(2007).
8. S. Sutton, “Sterility Tests” in Rapid Sterility Testing, J. Moldenhauer, Ed. (PDA/DHI Publ, Bethesda, MD, and River Grove, IL, 2011), pp. 7-24.
9. R. Field, “Bioburden Control at the Sterile Filtration Step: A Risk-Based Approach,” presentation to European Biopharmaceutical Enterprises (May 2013).
10. Critical Process Filtration Inc., “Particle Control & Clarification in Biopharmaceutical Production,” www.criticalprocess.com/LifeSciences/clarification.php, accessed March 25, 2017.
11. I. Bass, Six Sigma Statistics with Excel and Minitab (McGraw-Hill Professional Publishing, New York,1st ed., 2014).
12. S. Samip, P. Shridhar, and D. Gohil, Asian J. Pharm. 4 (3), 184-191 (2014).
13. T. Sandle, PDA J. Pharmaceutical Science and Technology 58 (4), 231-237 (2004).
14. M. Eissa, M. Seif, and M. Fares, Int. J. Qual. Assur. 6 (2), 54-72 (2015).
15. M.E. Eissa, A.M. Mahmoud, and A.S. Nouby, Dhaka Univ. J. Pharm. Sci. online, DOI: 10.3329/dujps.v14i2.28501 (Jan. 31, 2016).
16. M.E. Eissa, A.M. Mahmoud, and A.S. Nouby, RGUHS J. Pharm. Sci. online, DOI: 10.5530/rjps.2015.4.5 (Dec. 31, 2015).
17. J. Strachan, “Sources of Cleanroom Contamination,” http://www.climet.com/library, accessed April 4, 2017.
18. N. Walker, “Innovation at the Heart of Biopharmaceutical Industry Growth,” www.americanpharmaceuticalreview.com/Featured-Articles/187354-Innovation-at-the-Heart-of-Biopharmaceutical-Industry-Growth, accessed March 25, 2017.
Mostafa Eissa is quality compliance section head at HIKMA Pharma–Egypt